
Overview
Fama Technologies is an AI company that uses machine learning to gather and compile data points about people’s behaviors based on specific indicators found on their social media footprint. The core product is primarily used by organizations to screen potential candidates as well as existing employees and generates a behavior report for each person. The data collected on each report shows possible risky and positive behavior indicators, which empowers companies to make educated hiring and business decisions when acting on candidates or employees.

Product Goal
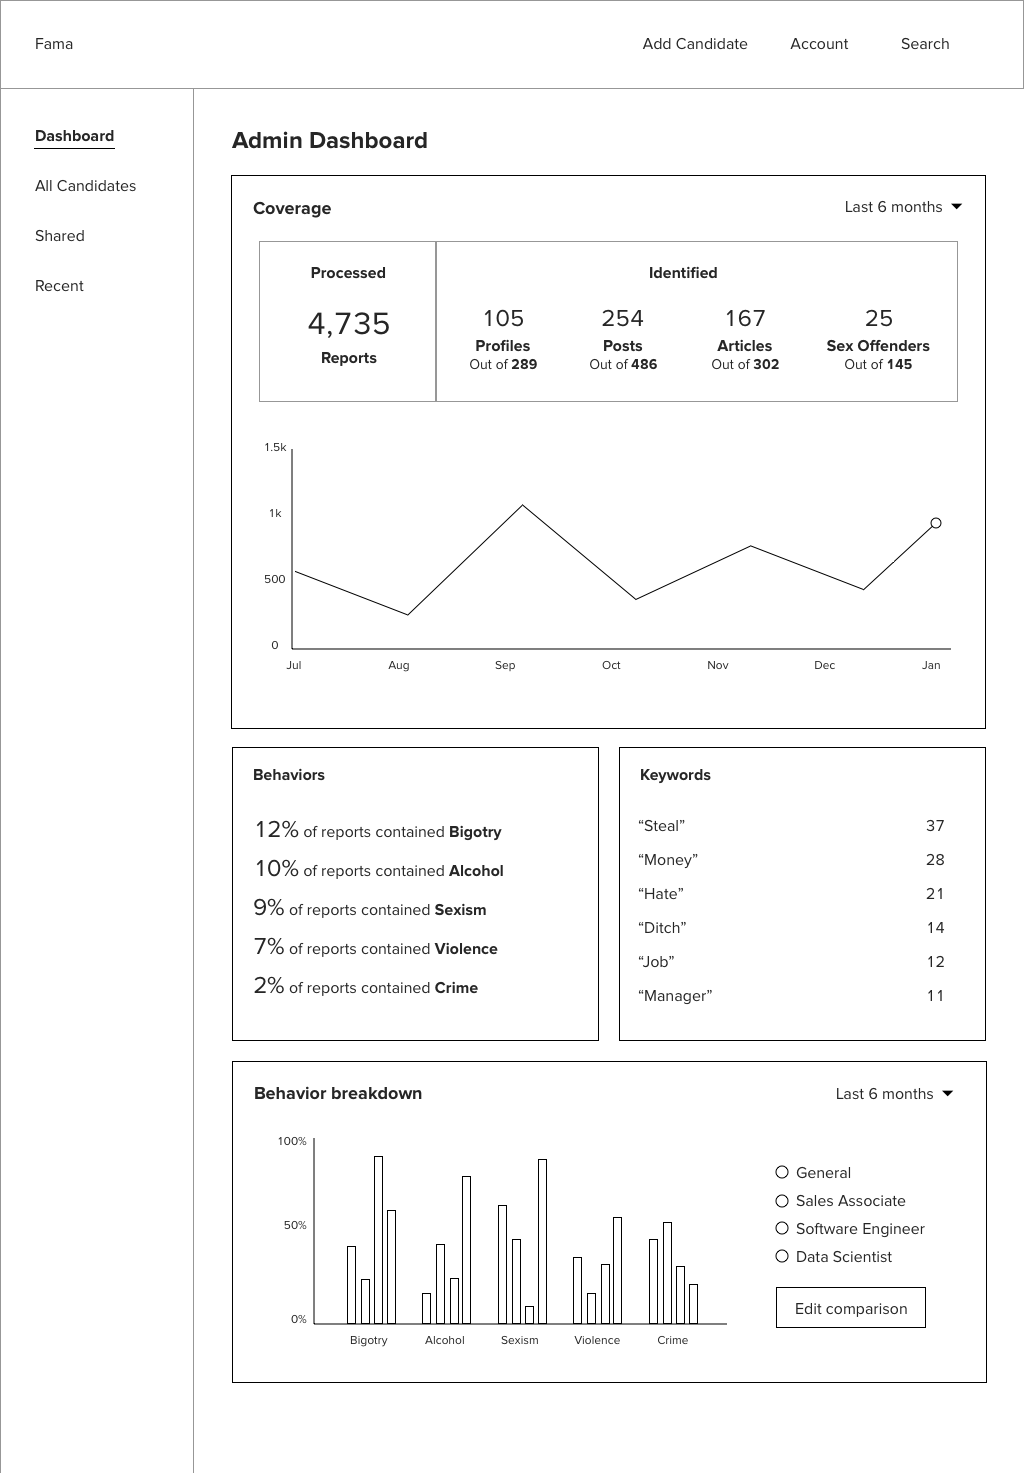
The goal of the Behavior Overview is to show users (HR Admins, Executives or any key decision makers) where the risks are in their organization. This is achieved by aggregating the data points collected from candidates or employees and displaying that data in the form of an interactive heat map. Users can then identify, at a high-level, which risky behaviors are the most prevalent and dive deeper into the data in order to identify exactly who is contributing to those behaviors.
Role & Responsibilities
My key responsibilities as Lead Product Designer was to conduct research, host usability testing sessions, solve the user experience challenges, prototype design concepts and handoff designs. Additionally, it was pivotal for me to collaborate closely with the Product Owner as well as cross-functionally with the Data Science, Engineering and Marketing. Each department had knowledge that would prove useful in designing this feature, so it became necessary to coordinate effectively with each of those teams.
Research
Understanding the goal and value of the Behavior Overview gave us a guideline in figuring out the best way to visualize and interact with the data. Our team looked at hundreds of different data visualizations for inspiration and learned what types of graphs best fit our set of data we were working with. We eventually narrowed down our research to the concept of an interactive heat map, as we felt this type of data visualization best communicated high-level data with the option to dive deeper into more granular data.
Information Architecture Explorations


Usability Testing & Prototyping
Due to the complexity and high-concept nature of this feature, it was an important part of our process to conduct frequent usability testing as each new prototype was created. We achieved this by hosting usability testing sessions internally and externally with clients, testing interactive wireframe prototypes of each concept, documenting our learnings and then iterating based on those learnings. This process allowed us to quickly understand where we were succeeding in our designs, but more importantly, where we were failing.
Without getting into the nuances of the testing and results, it is important to note that each subsequent iteration had design changes applied to it based on learnings from the previous iteration. After 10 iterations and several usability testing sessions, we landed on a conceptual and innovative circular heat map. We felt this iteration achieved the goal of displaying aggregated, high-level data in an exploratory and scalable user experience.
Wireframes & Iterations


Circular Heat Map Interaction Animation

High-Fidelity
Our process naturally allowed us to further iterate on fine details in the high-fidelity designs and prototypes. The most challenging user experience problem was solved, so at this stage, our usability testing had an emphasis on color, language, UI states, interactivity and animation.


Full Flow Interaction Animation

Handoff
Thorough documentation of behaviors and design specs was an integral part of building this feature and was very useful for the dev team as they were building it. Marvel App was used to build the prototypes from the Sketch files as well as generate handoff specs for the front-end engineers. These single-source-of-truth prototype and spec links were then documented on a static Confluence page to be attached to relevant stories in JIRA.
Interaction Documentation & Specs


Post Launch
When the Behavior Overview launched, our Customer Success team was trained internally on the feature’s capabilities so that they could accurately demonstrate it to existing and new clients. In general, clients were intrigued by the feature, but many noted that they would require some time to play with it and see where exactly something like this would fit into their existing workflow. User engagement with the Behavior Overview quickly fell shorter than desired, which shed light on it’s validity as a useful feature for clients. What we could have done better as a product team was hold more in-depth usability sessions and show side-by-side comparisons of alternative ways to display this data. This would allow for a more clear and honest direction to build the feature for users, as opposed to sticking with an idea in hopes that users will adopt it.